
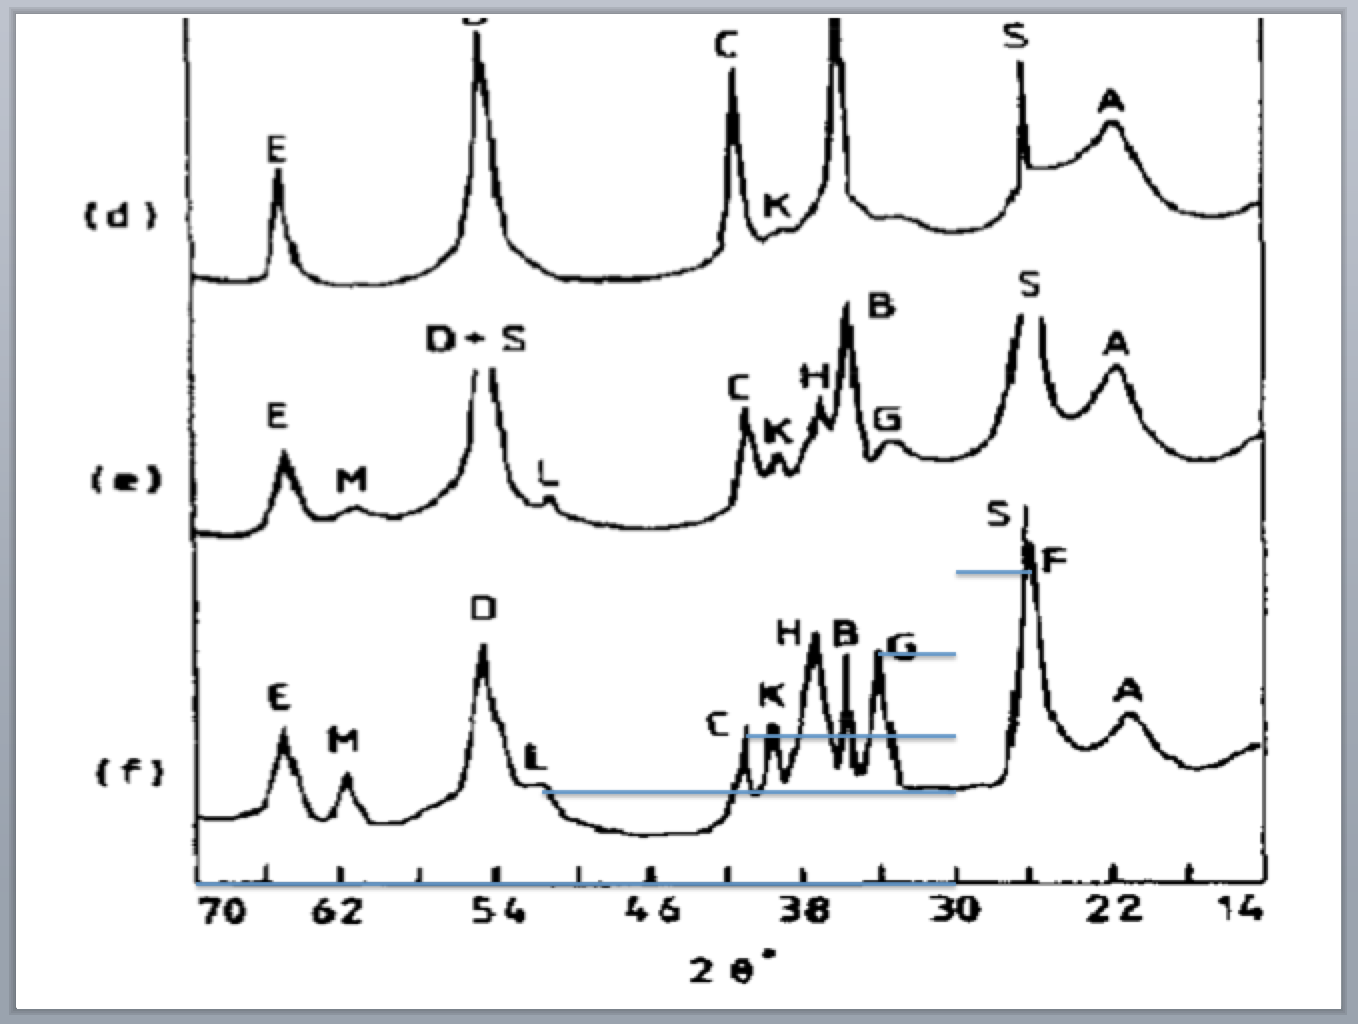
All the time I end up trying to extract data from a published plot, for example with the XRD traces above. My brute force method is to load the plot into some image program, then draw straight lines to all the important features. Up above I’ve drawn lines to peaks L, C, G, and F using 30 degrees as the origin. The line lengths tell you exactly where the peak maxima are, after you normalize them to a line drawn along the axis to get the scale.
Hey it’s a decent method and it works, but I was thinking how useful it would be to have a tool that reads an image file and can spit out the original data as a CSV. Turns out there are a few programs that do exactly that. I haven’t tried WebPlotDigitizer yet, but I will soon. If it’s the answer to all my hopes and dreams I’ll let you know.