In situ electrochemical microdiffraction

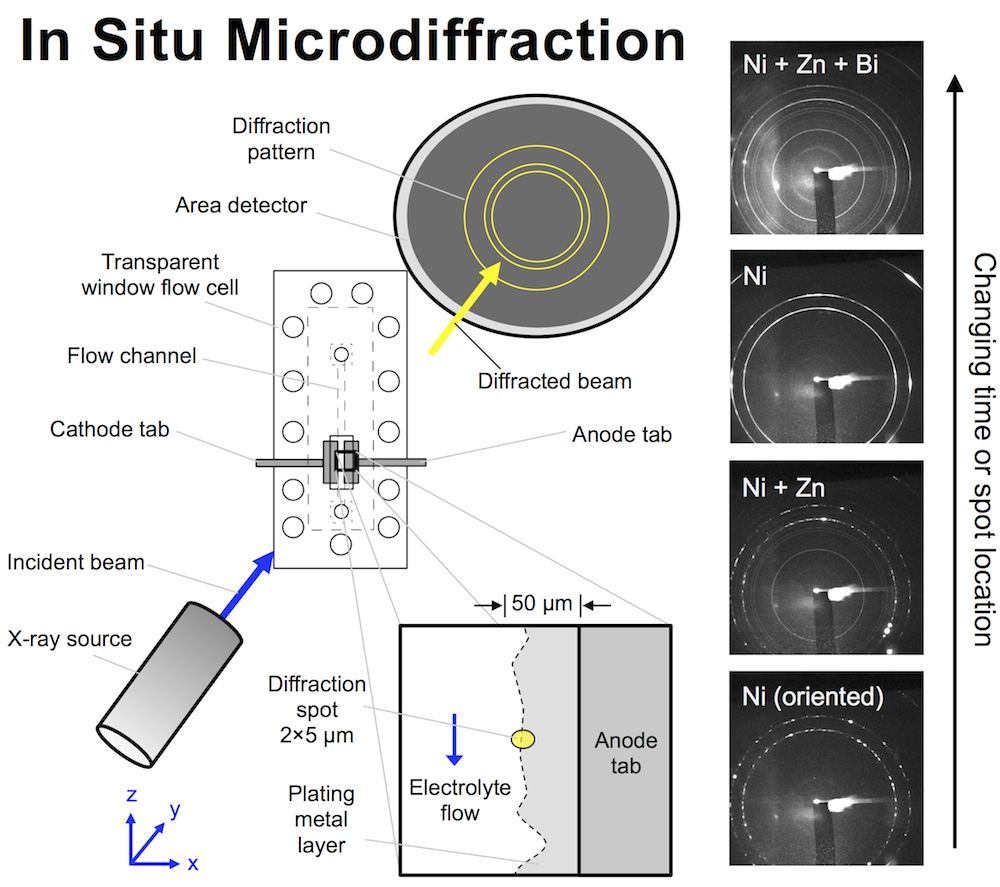
The high energy battery characterization I’ve been publishing about recently isn’t the only in situ technique that can shed light on battery materials. Combining electrochemical techniques with microdiffraction can tell you a lot about the composition of an interface between a battery material and electrolyte. Microdiffraction was developed at the National Synchrotron Light Source (NSLS) by Ken Evans-Lutterodt. It’s a kind of X-ray diffraction or XRD. The beam size is extremely small though, on the micron scale, and that’s why it’s described as “micro.”

microdiffraction setup small

We designed a flow cell that allows X-rays to hit an interface that is electrochemically active and has an electrolyte flowing past it. The X-ray beam penetrates the cell through a thin polyethylene window, and here the cell is only 150 μm thick, meaning even relatively low energy photons get through. The beam size is remarkably small: a small oval 2 x 5 μm, and the flow cell can be moved with sub-micron precision to focus the beam on the interface while a metal layer is plating there. The metal diffracts the beam, and an area detector on the other side records circular diffraction patterns. The ring pattern tells you what metals are in the diffraction spot, and their atomic spacing.

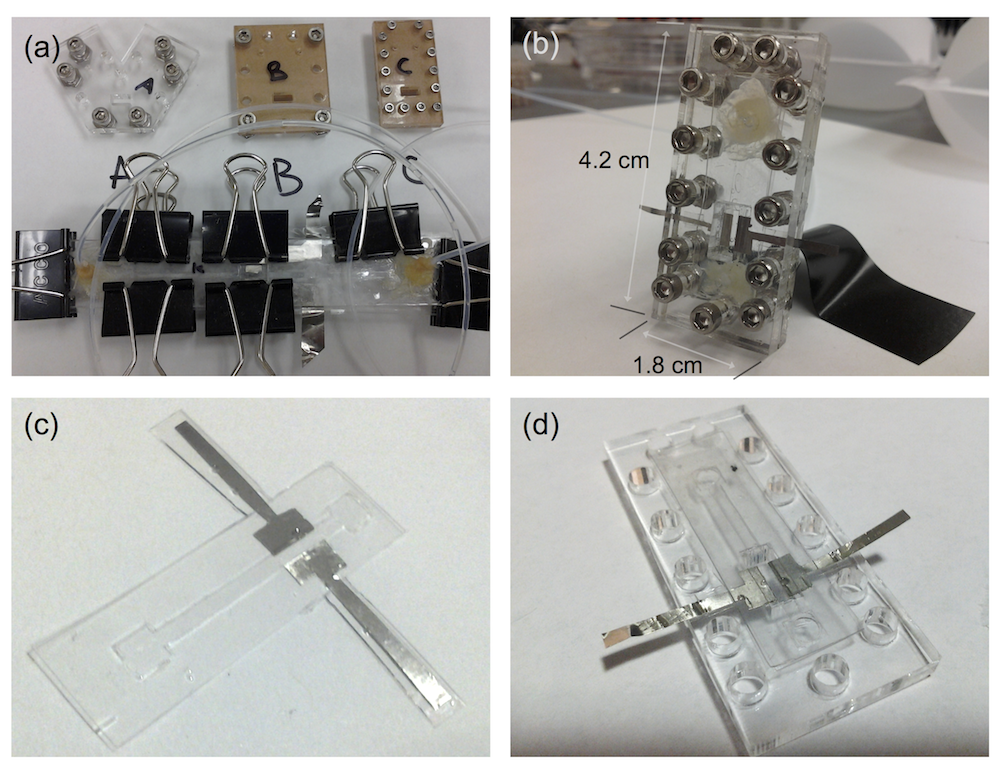
Preliminary designs for the small flow cell are shown below in panel (a), all of which ended up being too large or unwieldy in some way. The cell would have to fit in several beamlines at NSLS, and at one in particular it would have to have freedom to rotate 60 degrees without bumping anything. Taking into account the flow tubing and electrical wires, the fit would be tight. The first design, far too long and held together by binder clips, looks comical compared to the final design shown in (b). This cell has a paper-thin flow channel carved with a laser. The channel (c) is placed in the compression rig and screwed together (d).

flow cell designs small

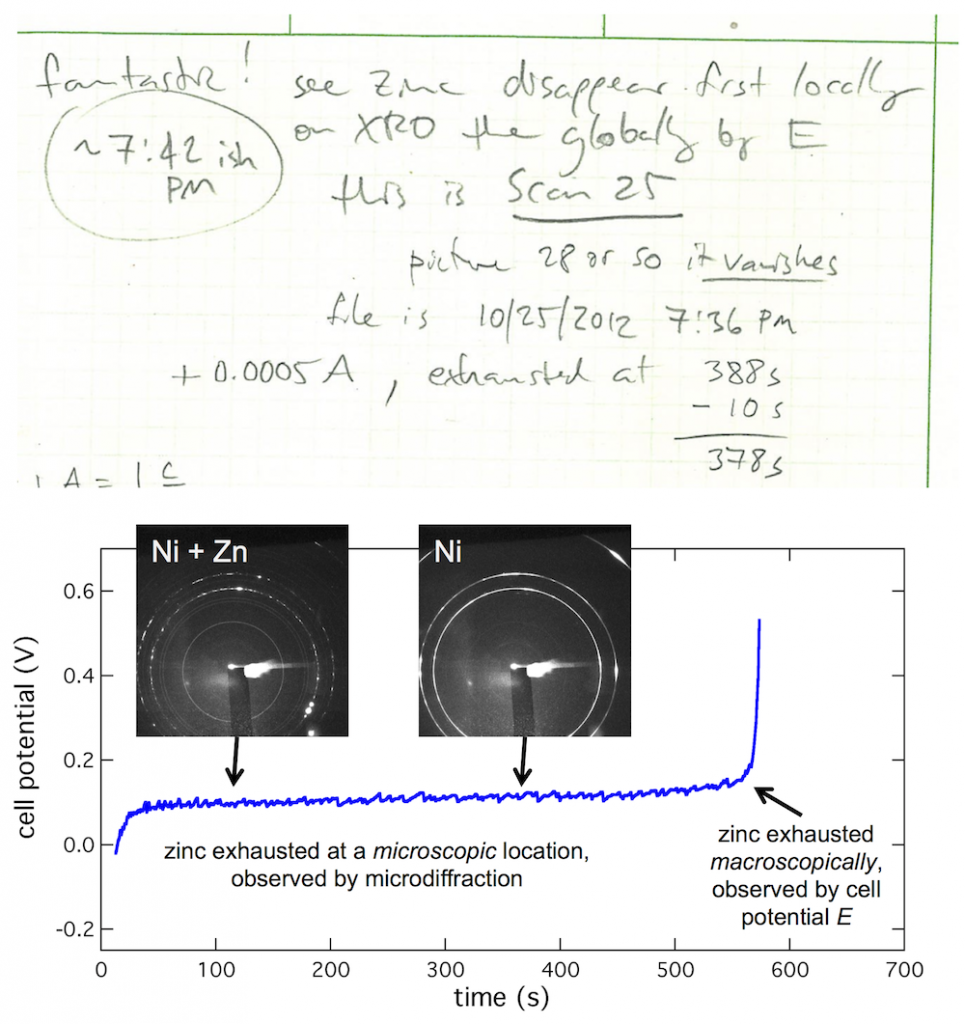
My lab book from the first visit to the beamline shows what kind of thing I was trying to see. I wrote “Fantastic! See zinc disappear first locally on XRD then globally by E.” (And apparently this first worked at about 7:42 PM.) What’s going on is this: zinc is on the anode tab, much as it would be in a battery, then you dissolve the zinc to discharge the battery. When all the zinc is gone, the cell potential (E) will shoot up to high voltage. But that is macroscopic, meaning an average over the entire anode. By focusing the beam on a particular microscopic spot on the anode, you see it dissolve there first, giving you an insight into that small spot in contrast to the entire anode.

xrd micro-macro small

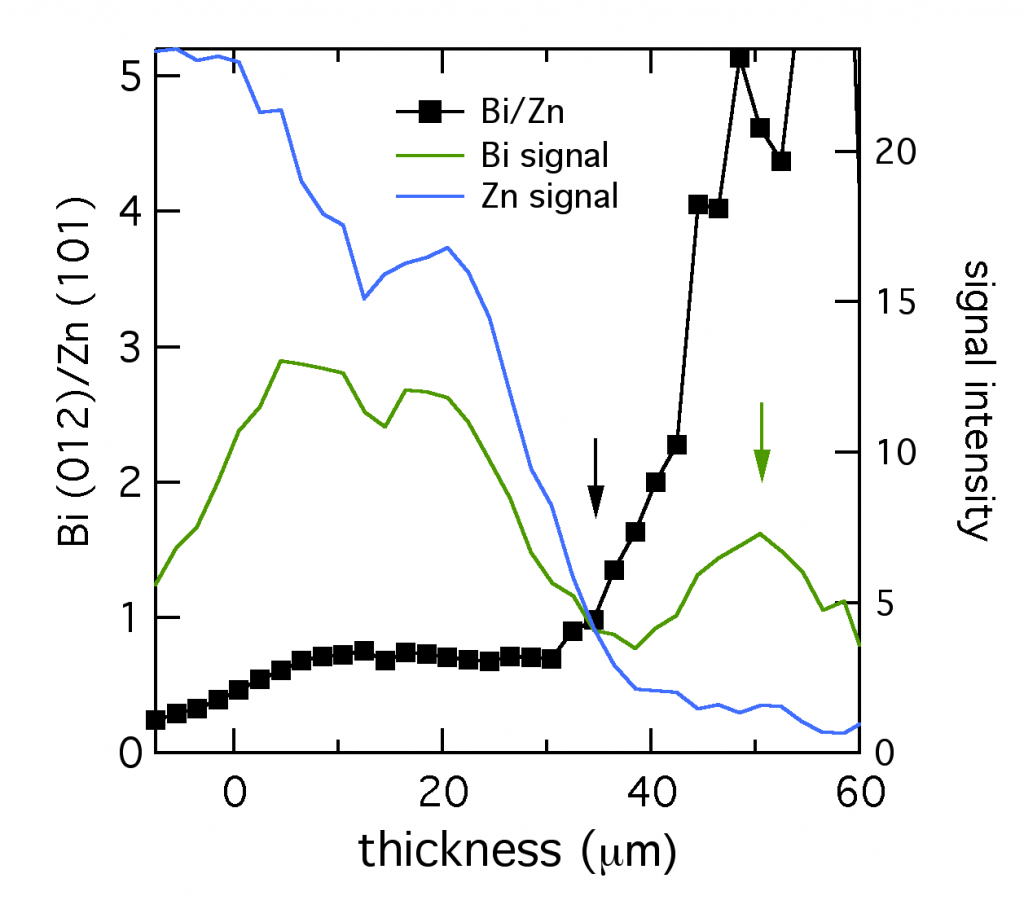
At CUNY we discovered that bismuth can be used to level zinc, but the mechanism wasn’t immediately clear. Using microdiffraction to scan through a zinc layer while it was being plated with bismuth gave a fascinating profile of the two metals, shown below. The XRD signal from the primary reflections of both Bi (012) and Zn (101) were plotted, along with their ratio. The layer was about 52 μm thick. Near the anode tab at 0 μm, the layer was bismuth-poor. Traversing through the layer toward the electrolyte interface, the composition became richer in bismuth, marked by the black arrow. Thus bismuth acts as a metal surfactant on zinc. (Published here.)

microdiffraction Bi-Zn ratio

At the very edge of the layer (shown by the green arrow), from 35 to 50 μm, the composition was almost entirely bismuth. The reduced bismuth signal there suggested this section could have the structure of a thin bismuth penumbra decorating the denser layer below. Since this data was collected in situ, this decoration might be a temporary structure present during electroplating, which is altered or destroyed by removing the layer from the electrolyte.

Modeling porous electrodes: Part 2

A secondary current distribution model considers:

  1. Ohm’s law resistance, and
  2. kinetic charge-transfer resistance

while resistance related to concentration variations is ignored. Beginning with the equations given in Modeling porous electrodes: Part 1, the following can be written:

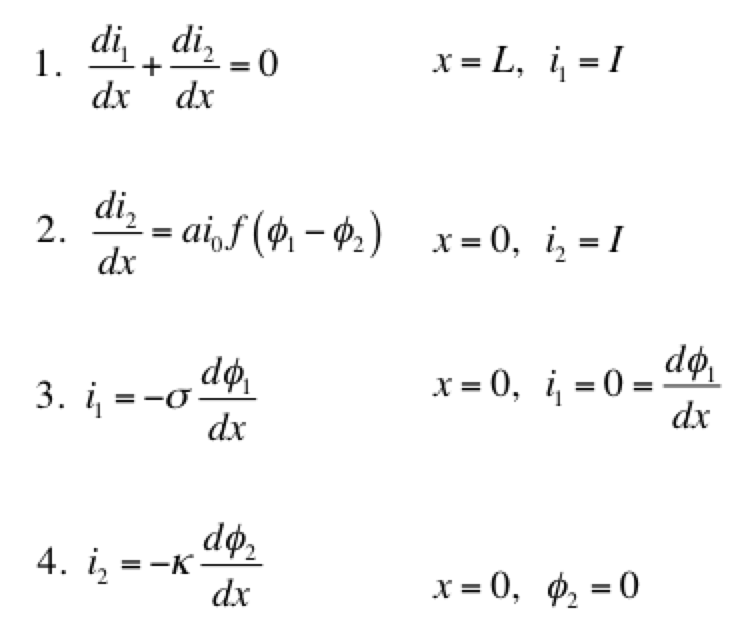
Porous 2 equations

Eq 1 is conservation of charge; Eq 2 is some expression of electrochemical reaction kinetics; and Eqs 3 & 4 are Ohm’s law for the solid and liquid phases. The boundary conditions are such that a current density of I is being produced by the electrode. The liquid phase potential φ2 is arbitrarily set to 0 V at x = 0. The specific expression for the electrode kinetics (Eq 2) needs to be specified. The concentration-independent Butler-Volmer expression can be used:

Porous-2-Butler-Volmer.png

The left hand side of this expression is the transfer current, with units of A/cm3, and gives the amount of electrochemical reaction occurring at any point. The right hand side has two components: the anodic and cathodic kinetic terms. The downside of the Butler-Volmer equation is its complexity. Finding an analytical solution to the above set of differential equations requires a more simplified kinetic expression. One possible simplification is to assume the overpotential (φ– φ2) is highly negative. This means only the cathodic term in the Butler-Volmer equation need be considered:

Porous-2-Tafel

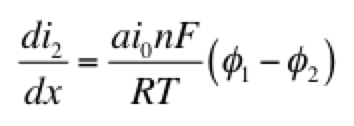
The right hand side of this expression is a form of the Tafel equation. (An analogous anodic form can be used when overpotential is highly positive.) Another possible simplification is to assume the overpotential (φ1 – φ2) is small. In this case both anodic and cathodic terms are important. Substituting the first two terms of a Taylor series for the exponentials results in:

Porous-2-linear

This linear kinetic expression is valid only at low currents. Which approximation of the kinetic expression is appropriate depends on the conditions of interest. Choosing the following values for physical parameters:

  • electrode area per volume, a = 23,300 cm-1
  • transfer coefficients, αaαc = 0.5
  • exchange current density, i0 = 2 x 10⁻⁷ A/cm2
  • current density, I = 0.1 A/cm2
  • length, L = 1 cm
  • electrolyte conductivity, κ = 0.06 S/cm
  • electrode conductivity, σ = 20 S/cm

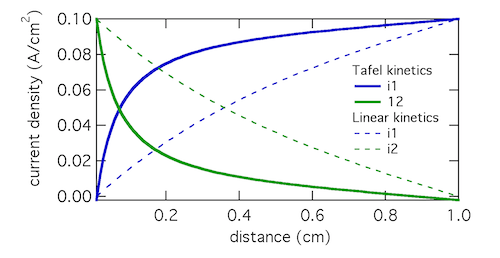
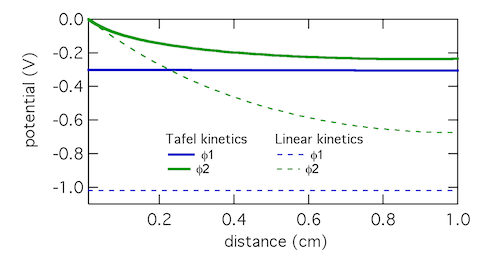
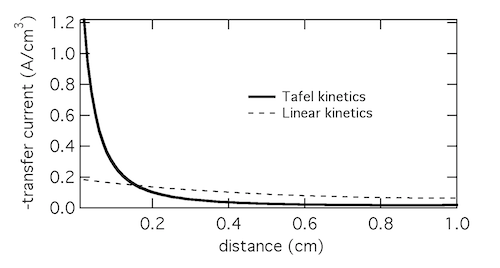
we assume that the Tafel approximation for kinetics will be valid, because the current density is much larger than the exchange current density. Solving the set of equations 1-4 for both Tafel and linear kinetics gives the results below:

 Porous electrode current

Porous electrode potential

The Tafel kinetic expression predicts that current exchange from liquid to solid phases (ionic current to electronic current) will be concentrated near x = 0, the location closest to the counter electrode. There (φ1 – φ2) will be near 300 mV, falling away further into the electrode. In contrast, the linear kinetic expression predicts a more even exchange of current through the electrode, and much higher values of (φ1 – φ2). This is because the linear expression is a softer function of overpotential than the exponential one. The Tafel approximation is clearly the more appropriate in this case because (φ1 – φ2) » RT/F which is 25.7 mV at room temperature.

2015-03-04 taf-lin trans

Plotting the transfer current di2/dx shows that in reality the electrochemical reaction is concentrated in the front 10% of the electrode. Linear kinetics tend to result in more uniform current distributions, but for this to be the case i0 > I will need to hold.

Click here for Modeling porous electrodes: Part 3, which is about solving porous electrode problems using Newman’s BAND method.