Modeling porous electrodes: Part 1

Useful electrochemical devices often employ porous electrodes. This is because electrochemistry is by definition an interfacial phenomenon, usually happening where a liquid and a solid meet. Porous electrodes offer a high surface area, allowing a lot of reaction to be packed into a small space.

Duracell cross section

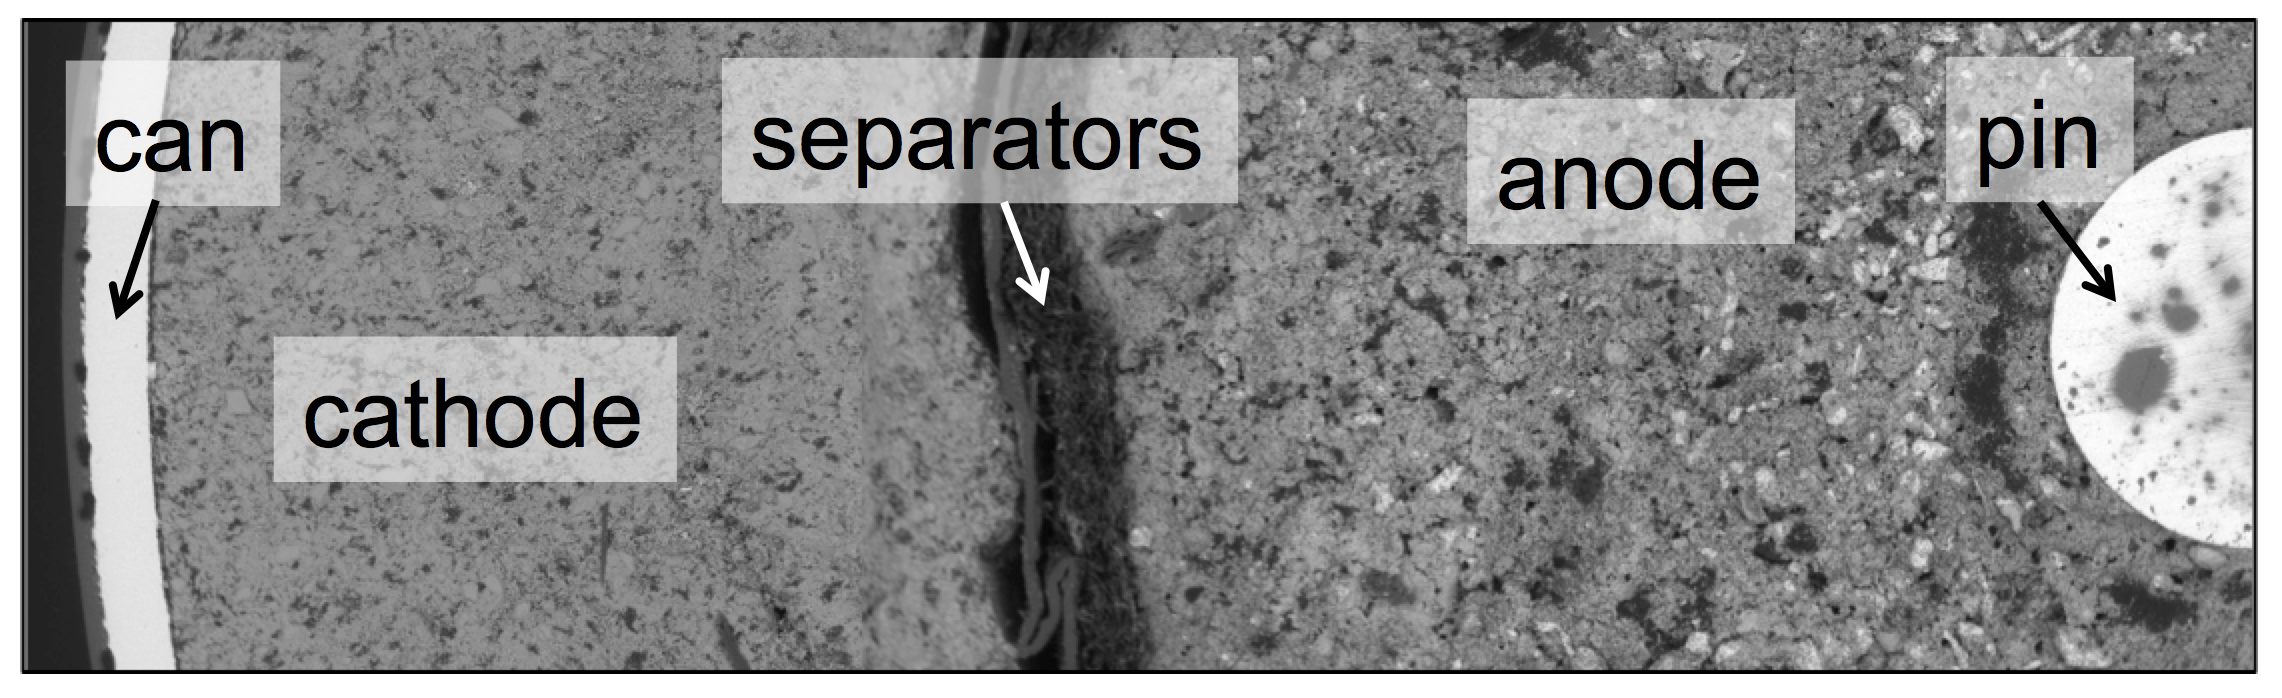
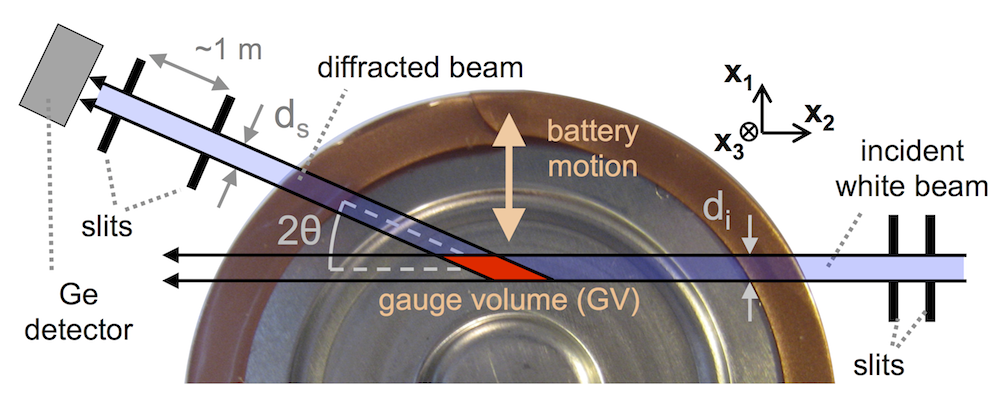
The SEM image above shows the cross-section of a Duracell AA battery, contained by a cylindrical can, with a pin at the center. The two electrodes, cathode and anode, take up most of the space inside. Both electrodes are made of particles, with liquid electrolyte filling the pores in between. A porous separator keeps the cathode and anode from touching each other and shorting.

Porous electrode theory was developed in the 1950s and 1960s to allow modeling of these kinds of electrochemical devices, and it has been successful at explaining many of the empirical facts one observes when using them. Much cutting-edge electrochemical engineering continues to rely on porous electrodes, from bioelectrochemical cells to the batteries in the Tesla Model S. Porous electrode theory is well understood, but even the most modern textbook treatments resemble journal articles in how they are structured and written. This post is an attempt to describe the theory in an accessible way. Fundamentally, the problem is a highly relevant form of transport phenomena, and should be understandable to a wider engineering audience.

A simple porous electrode model:

Ultimately a battery like the one above is part of an electrical circuit, and current must travel across the cell, from pin to can. We call the pin and can “current collectors” because they don’t participate in reactions, and are there to connect the circuit to the anode and cathode. If porous electrodes are designed well, there are ample conduction pathways through both the particle (solid) and electrolyte (liquid) phases. “Current” is the movement of charge. In solids, charge typically moves as electrons, which are negatively charged. In liquids, charge moves as ions, which may be positive or negative.

porous electrode pic 1

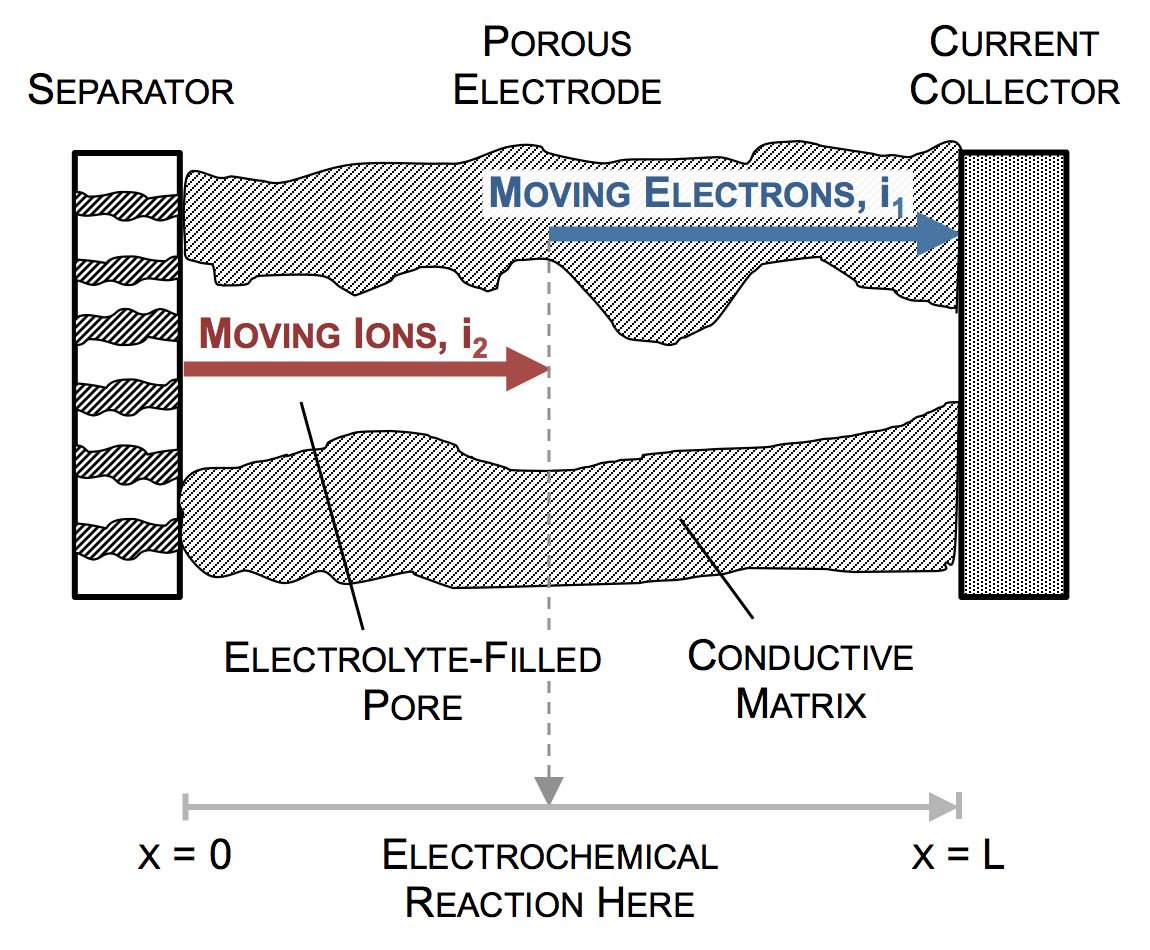
In the picture above, the complex network of pores through an electrode are described as a single pore, which extends from separator to current collector. The direction across the electrode is given by x, and we use rectangular coordinates to keep the math simple. (Thus, this is one electrode or half of the battery above, but in a rectangular configuration instead of a cylindrical one.)

The separator will not allow electrons to pass, and thus only ionic current can come through at x = 0. The current collector will not allow ions to pass, so only electrons can flow out at x = L. This is the essence of the porous electrode model: the total current flow from separator to current collector is constant: the current across the circuit, denoted as I. However, across the porous electrode it may travel either as ions or as electrons. The only necessity is that it must be all-ionic at the separator and all-electronic at the current collector.

Ionic current and electronic current may be converted to one another by an electrochemical reaction. In fact, this is the definition of electrochemistry: the study of reactions that involve both chemicals (ions) and electricity (electrons). In the picture above a unit of ionic current ends at the same location where one of electronic current begins. In reality, the ion causing the ionic current turns upward, contacts the pore wall, and there participates in the liberation of an electron. But for simplicity, we draw the entire thing as involving only motion in the x-direction.

porous electrode equations

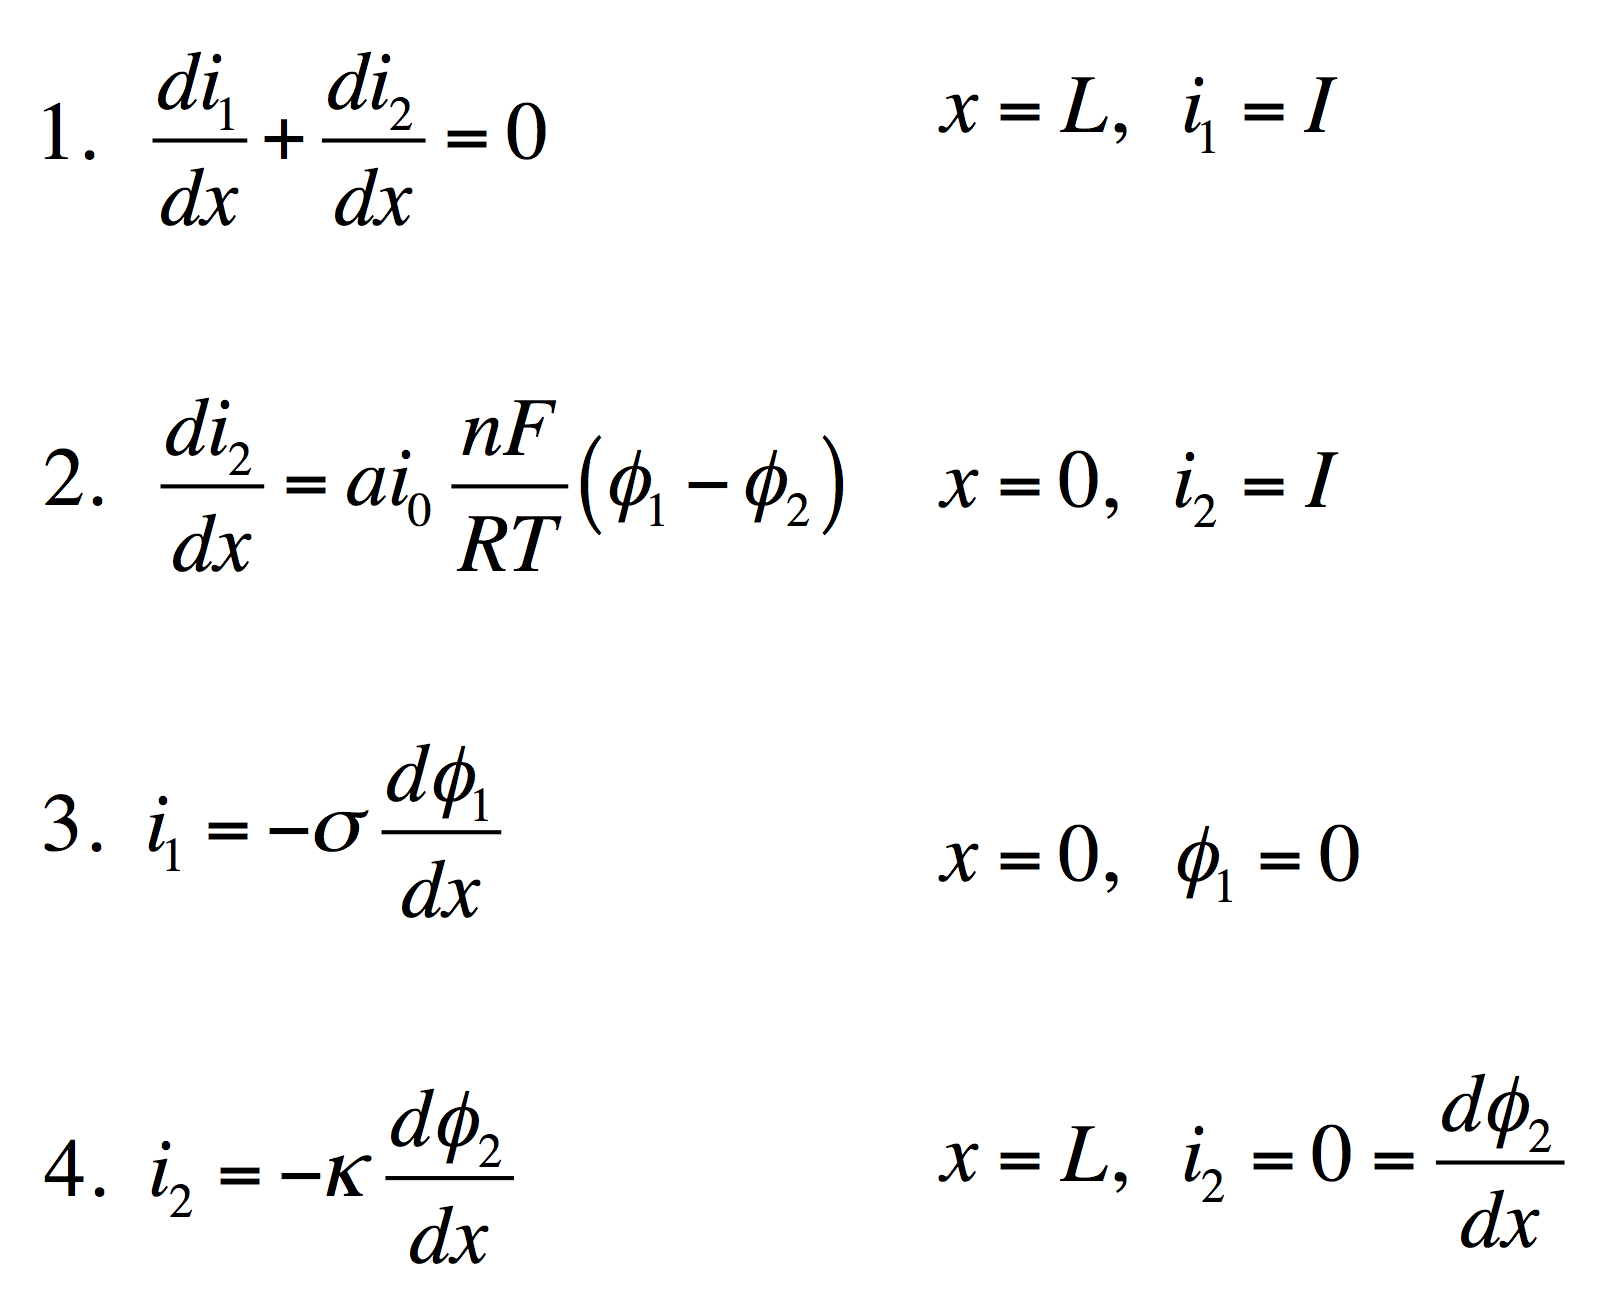
These four equations describe a steady-state porous electrode operating this way, with boundary conditions given on the right. The four unknowns are i1 and i2, the electronic and ionic currents at any x, and φ1 and φ2, the electric potentials in the solid and the liquid.

  1. Conservation of charge. The equation states that any i2 that disappears must be matched by appearance of i1 and vice versa. The boundary condition states all current is electronic at the current collector.
  2. Rate of electrochemical reaction. The equation states that i2 disappears by an interfacial reaction that is driven (linearly) by the potential difference between the solid and liquid. The boundary condition states all current is ionic at the separator.
  3. Ohm’s law in the solid. This relates current to potential gradient. The boundary condition arbitrarily sets the solid potential to zero at the separator.
  4. Ohm’s law in the liquid. The boundary condition states the liquid potential gradient is zero at the current collector.

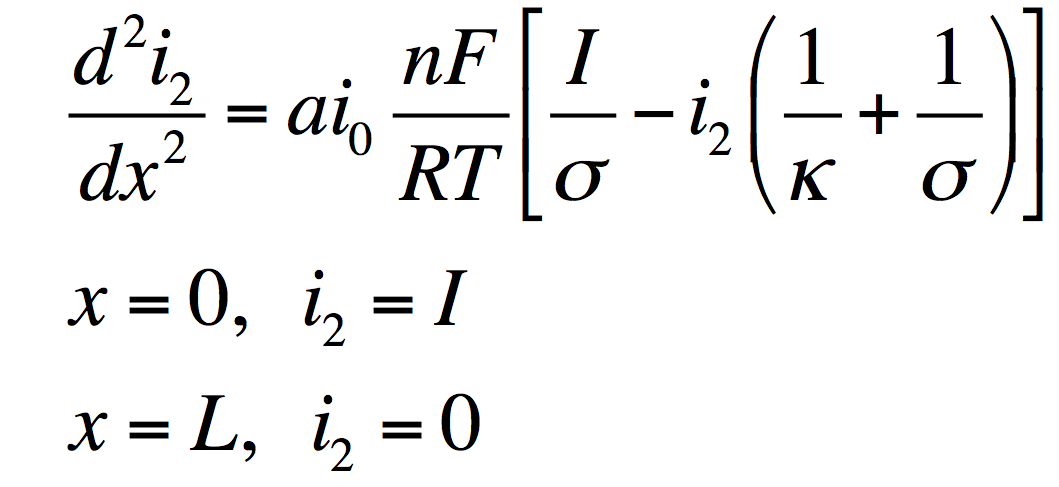
These can be manipulated into a single equation:

porous electrode eqs 2

This has the solution:
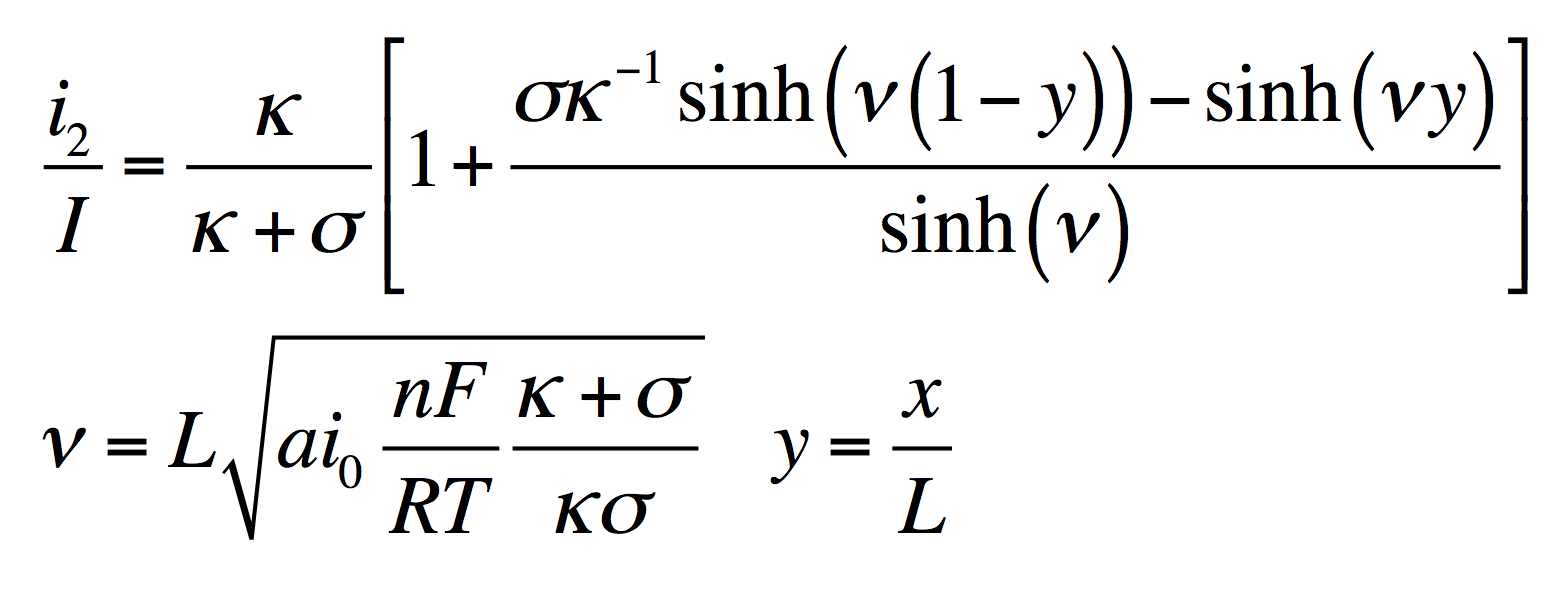
linear porous electrode solution

From this i1φ1, and φ2 can be found by substitution into the original equations.

porous electrode pic 2

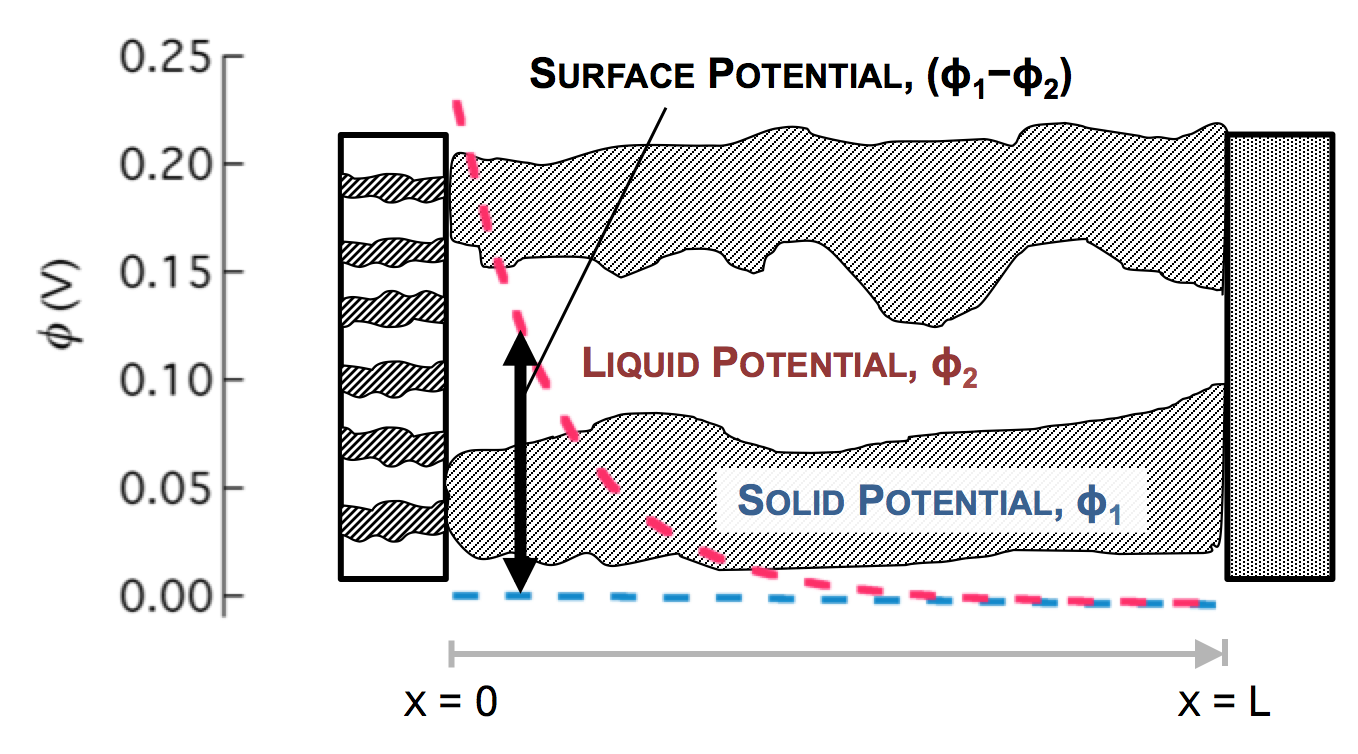
Values typical for a porous battery electrode can be used to plot the variables:

  • electrode area per volume, a = 23,300 cm-1
  • exchange current density, i0 = 3.5 x 10⁻⁶ A/cm2
  • current density, I = 0.1 A/cm2
  • length, L = 1 cm
  • electrolyte conductivity, κ = 0.06 S/cm
  • electrode conductivity, σ = 20 S/cm

The disparity in conductivities results in the general behavior we observe. The solid potential φ1 changes very little due to its high conductivity. However, in the liquid there is a large change in φ2 near the separator. The reaction driving force in equation 2 is the difference in these potentials, the surface potential. Thus there is substantially more reaction near the separator than elsewhere in the electrode.

porous electrode pic 3

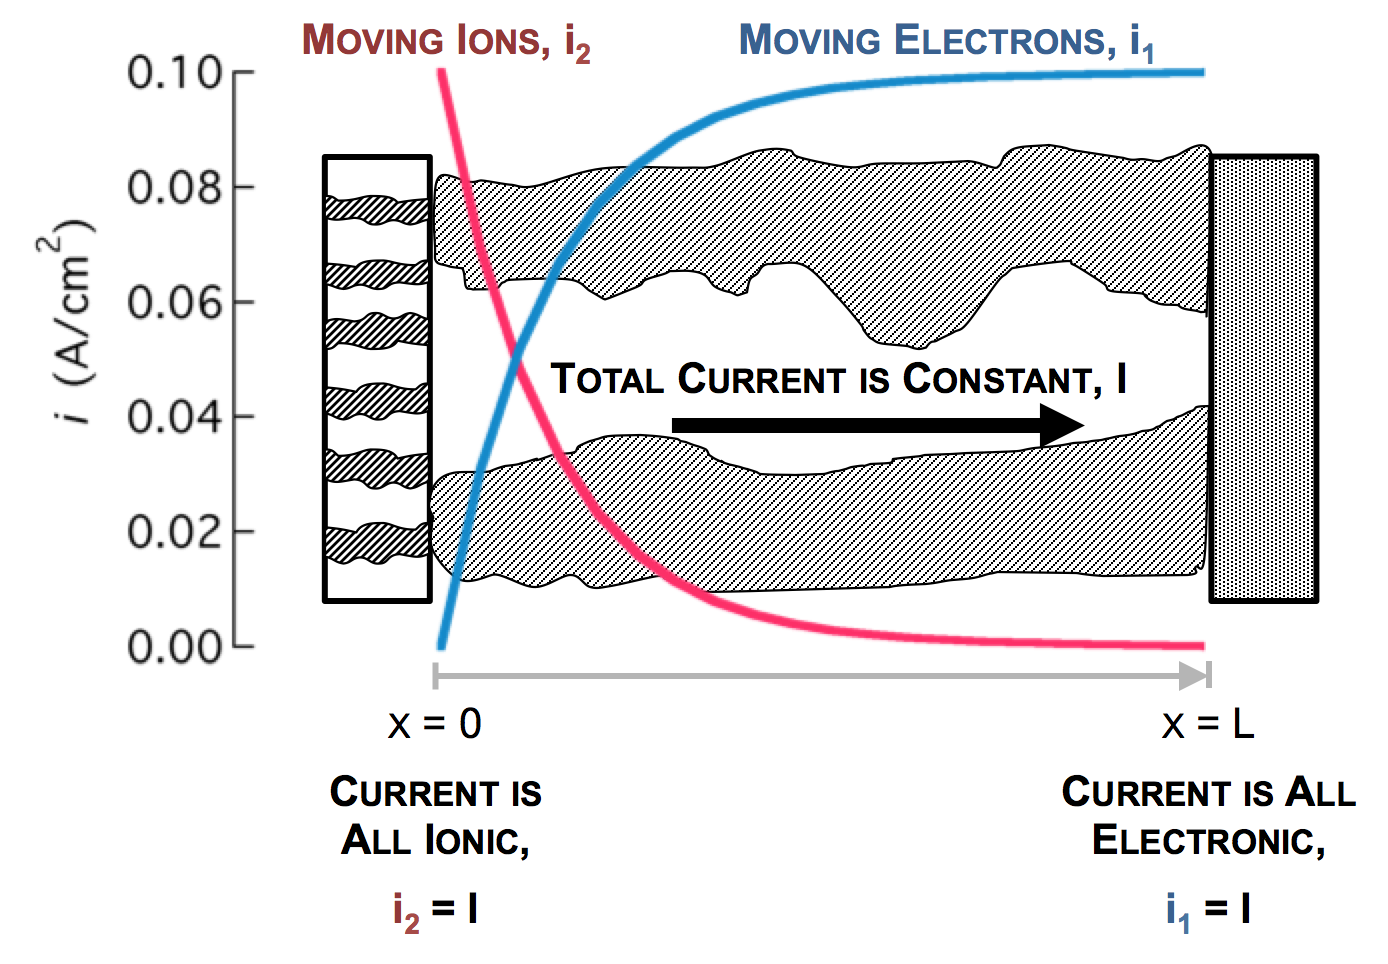
As the reaction causes conversion of i2 to i1 the current profiles change greatly near the separator. The total current is always i1 + i2 = I at any point.

Click here for Modeling porous electrodes: Part 2, which is about the difference between linear and Tafel kinetics.

Click here for Modeling porous electrodes: Part 3, which is about solving porous electrode problems using Newman’s BAND method.

Let there be more light

Some new publication news is coming up, because we’ve had two manuscripts accepted this week.

But first, check out this beautiful image from Brookhaven National Lab. Last Wednesday was a terribly rainy day here in New York, but during a break in the rain someone got this great shot of a rainbow, which just happens to begin at the NSLS and end at the NSLS-II.

NSLS Rainbow

“Last light” at the National Synchrotron Light Source (NSLS) was September 30, 2014. “First light” at NSLS-II, its newer, brighter replacement, was October 23, 2014, the morning after the rainbow. NSLS-II, located about halfway out Long Island, will be the world’s brightest light source.

Over the last couple years, this electrochemist has had the good fortune to also become a nascent, sometimes hesitant X-ray spectroscopist. In the messy and interdisciplinary world of battery science there’s a lot of information you need from X-rays, so you can tell what exactly is going on inside batteries while they’re charging and discharging. Batteries contain many secrets, sealed inside their casings. Hopefully we’ll get to learn just as much from NSLS-II as from its storied predecessor. Here’s a photo of me doing research at NSLS just a few days before it shut down:

X-ray Murder

More upcoming work: Probing the materials inside batteries

This summer we accomplished a lot of further data analysis from a collaboration with researchers at Brookhaven National Lab. We’ve been using cutting edge tools there to identify the materials inside batteries without opening up the battery case, exposing the electrodes to air, or even getting dirty. We published a preliminary paper earlier in 2014, but there is still quite a bit to learn.

BATT FIG

You do this using a technique called EDXRD (or energy dispersive X-ray diffraction). You shine X-ray light with very high energy and very high intensity through the battery. This is called a “white beam” because it has a wide spectrum of wavelengths in it. (That basically means many different “colors” of X-rays. And light with all the colors in it is called “white.”) Some of the light is diffracted by the regularly-occuring patterns of atoms in the battery electrodes, and you set up a detector outside the battery (and several feet away) to measure how much light of each wavelength gets diffracted. Since you’re several feet away and aligned very carefully, you know everything you’re learning pertains to a very small “gauge volume” inside the battery. (In the above cartoon it’s enlarged many times to make it easy to see, but it’s actually cubic microns in size.)

By moving the battery around using a precise x-y-z stage, you can “look around” inside it and see what materials are at every location, provided they’re crystalline enough to diffract X-rays.

AA_capacity1

Take for example a basic rule about batteries: if you discharge them faster you will reduce the capacity you get out of them. The plot above shows discharge curves for two AA alkaline batteries. At a high drain rate of 571 mA you get about 1.7 Ah from the cell, while at 18.1 mA you get double that, about 3.4 Ah. The interesting thing is that these two batteries have entirely different material compositions inside them after discharge. In fact, if you do six different rates, you will get six batteries with six different material profiles in the electrodes. Using a powerful tool like this, you can begin to figure out the extremely complex set of reactions that happen during discharge, which are, believe it or not, largely unknown.

Extracting data from a plot

Screen Shot 2014-08-23 at 11.02.27 AM

All the time I end up trying to extract data from a published plot, for example with the XRD traces above. My brute force method is to load the plot into some image program, then draw straight lines to all the important features. Up above I’ve drawn lines to peaks L, C, G, and F using 30 degrees as the origin. The line lengths tell you exactly where the peak maxima are, after you normalize them to a line drawn along the axis to get the scale.

Hey it’s a decent method and it works, but I was thinking how useful it would be to have a tool that reads an image file and can spit out the original data as a CSV. Turns out there are a few programs that do exactly that. I haven’t tried WebPlotDigitizer yet, but I will soon. If it’s the answer to all my hopes and dreams I’ll let you know.

New Book About Enzyme Electrodes

Screen Shot 2014-05-15 at 10.28.12 PM

I wrote Chapter 9 in Enzymatic Fuel Cells: From Fundamentals to Applications, which is coming out May 19th. It’s edited by Plamen Atanassov, Heather Luckarift, and Glenn Johnson. The book grew out of a multi-university research project I was part of as a graduate student, with the goal of using biological catalysts for small power sources.

This is controversial research: it is, trust me. But if it works it has a high payoff. Summarizing just one possible application: we as humanity use an expensive element, platinum, for almost all of our room-temperature catalysis. This is why you don’t own very many things that involve room-temperature catalysis. However, living things do catalysis at physiological temperature (98.6 degrees F, not much higher) all the time. If we could use their tricks, catalysis would get much less expensive.

Some enzyme electrodes actually have incredibly high volumetric energy densities. The ones I was making as a graduate student reduced oxygen at 40 A/cm3 at 0.7 V, which is higher than some old-school platinum electrodes, and they do all the catalysis with copper. The downside is they don’t last a long time. But since platinum is 21,000 times more expensive than copper, it could be worth it.

My chapter gave a me a chance to summarize my graduate research in a unified way, making the point I wanted to make. Essentially I showed you could double the catalytic current of one of these electrodes by being smarter about the transport phenomena involved. I published the results in two papers with dry, academic titles, because let’s face it I sometimes like the dry and academic. Only now, after a few more years of experience, I feel it would have been better to publish them together and title it The Point Is The Current Is Twice As High. Here’s the important graph below (from here):

Screen Shot 2014-05-16 at 10.10.59 AM

See how the curves are S-shaped, and the bottom part is at about -7 mA/cm2 in one case and about -14 mA/cm2 in another? That’s the doubling. There’s actually a more important figure earlier in the paper, but this one is the easiest to explain. Science: it’s also about communication.