In situ electrochemical microdiffraction

The high energy battery characterization I’ve been publishing about recently isn’t the only in situ technique that can shed light on battery materials. Combining electrochemical techniques with microdiffraction can tell you a lot about the composition of an interface between a battery material and electrolyte. Microdiffraction was developed at the National Synchrotron Light Source (NSLS) by Ken Evans-Lutterodt. It’s a kind of X-ray diffraction or XRD. The beam size is extremely small though, on the micron scale, and that’s why it’s described as “micro.”

microdiffraction setup small

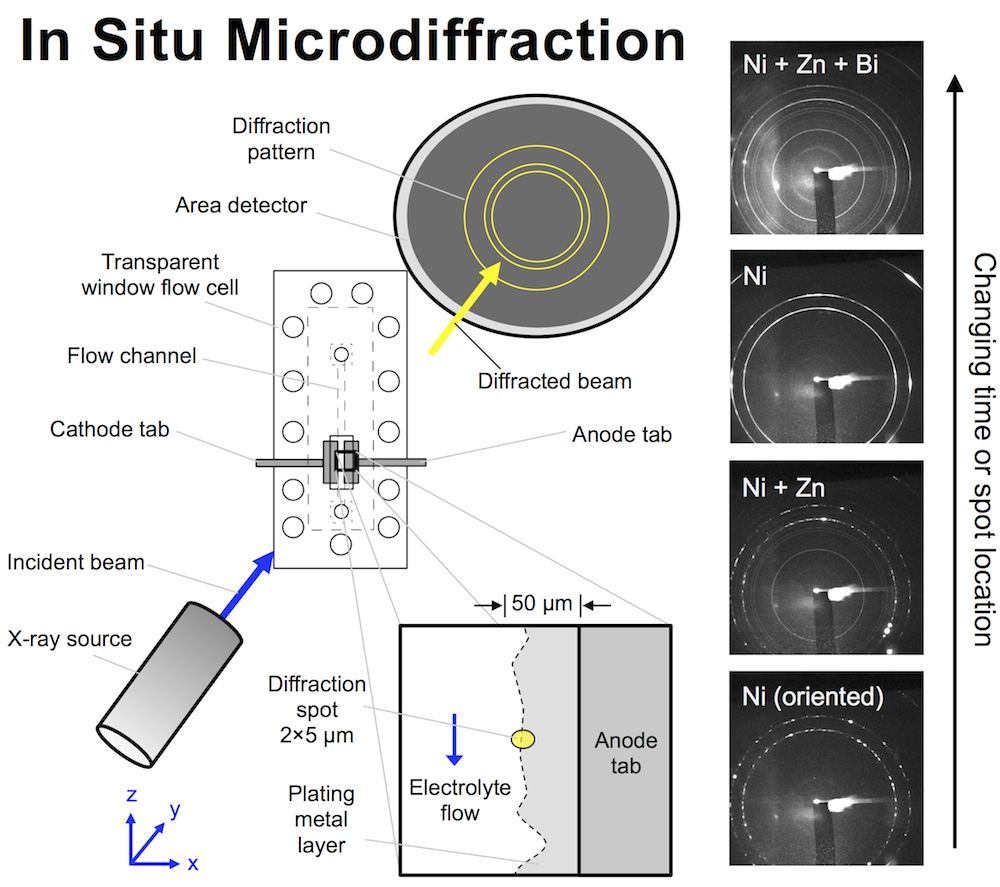
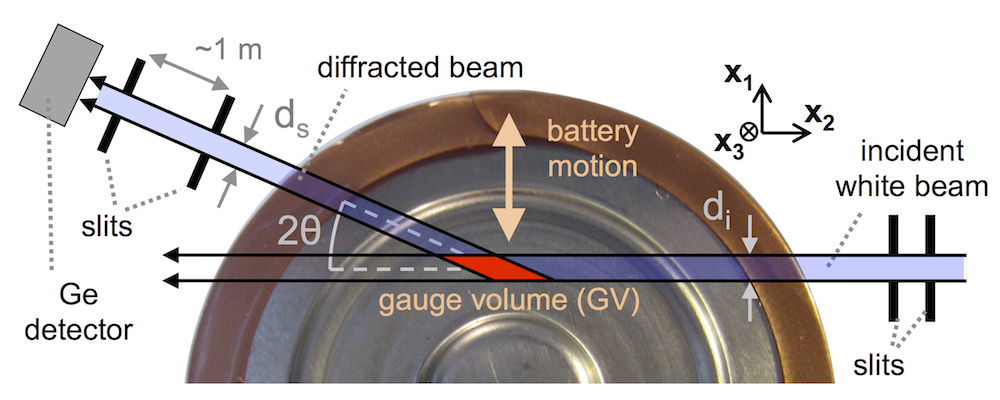
We designed a flow cell that allows X-rays to hit an interface that is electrochemically active and has an electrolyte flowing past it. The X-ray beam penetrates the cell through a thin polyethylene window, and here the cell is only 150 μm thick, meaning even relatively low energy photons get through. The beam size is remarkably small: a small oval 2 x 5 μm, and the flow cell can be moved with sub-micron precision to focus the beam on the interface while a metal layer is plating there. The metal diffracts the beam, and an area detector on the other side records circular diffraction patterns. The ring pattern tells you what metals are in the diffraction spot, and their atomic spacing.

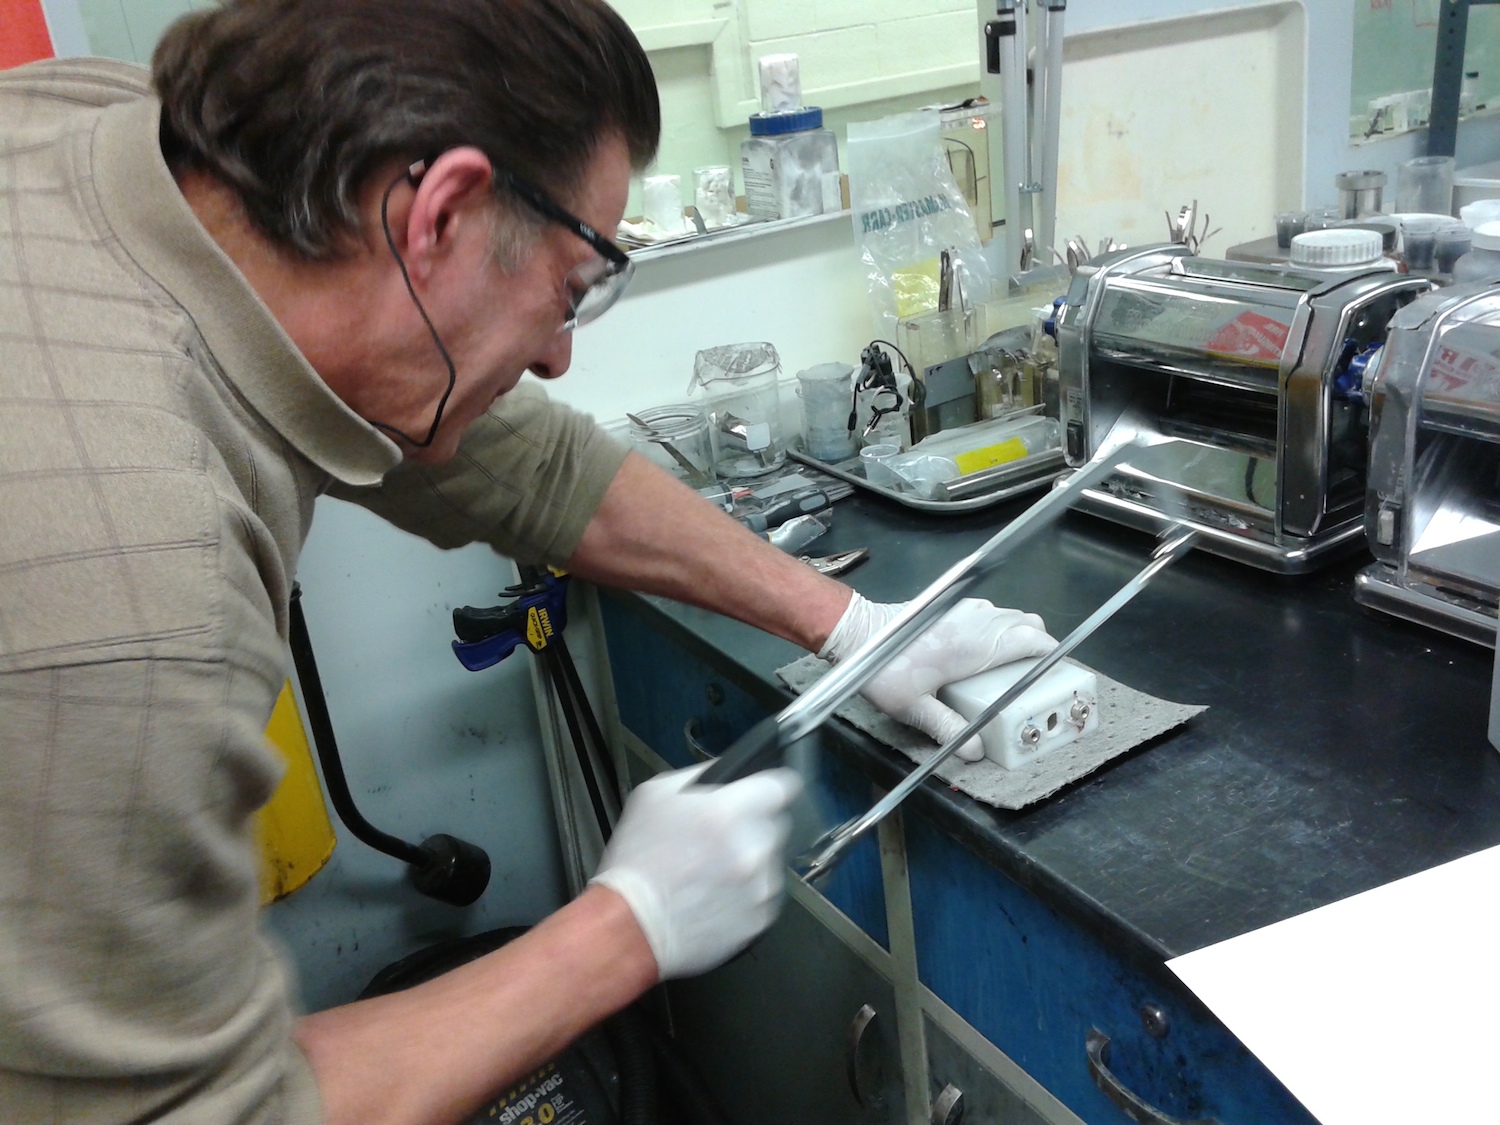
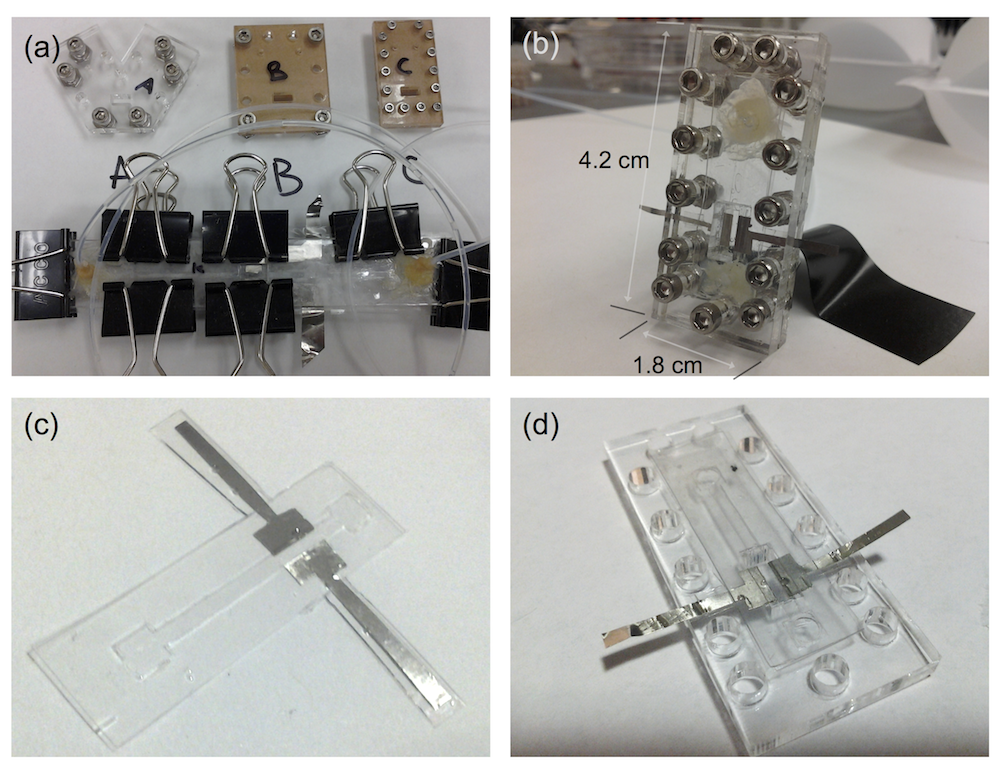
Preliminary designs for the small flow cell are shown below in panel (a), all of which ended up being too large or unwieldy in some way. The cell would have to fit in several beamlines at NSLS, and at one in particular it would have to have freedom to rotate 60 degrees without bumping anything. Taking into account the flow tubing and electrical wires, the fit would be tight. The first design, far too long and held together by binder clips, looks comical compared to the final design shown in (b). This cell has a paper-thin flow channel carved with a laser. The channel (c) is placed in the compression rig and screwed together (d).

flow cell designs small

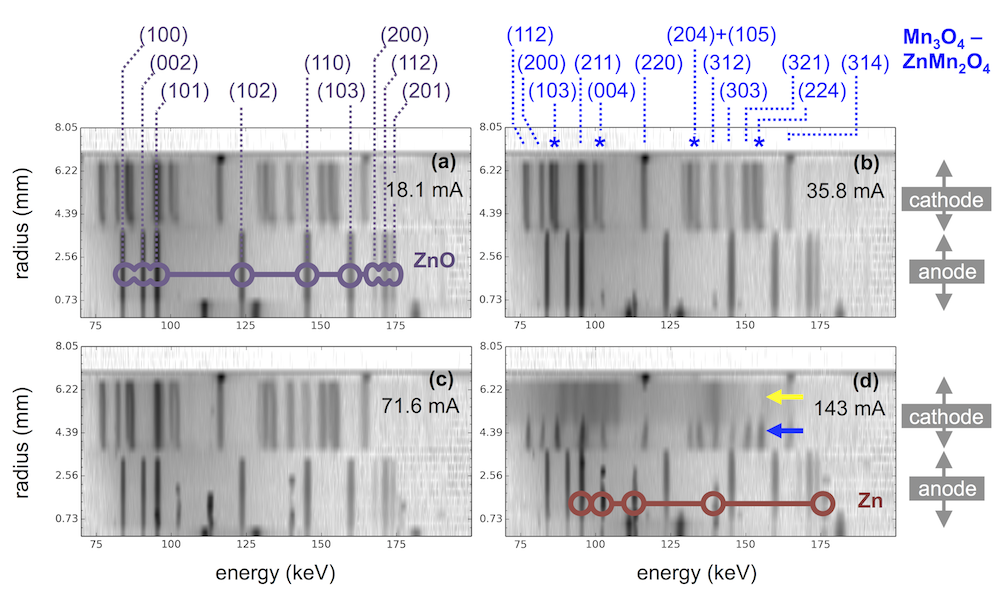
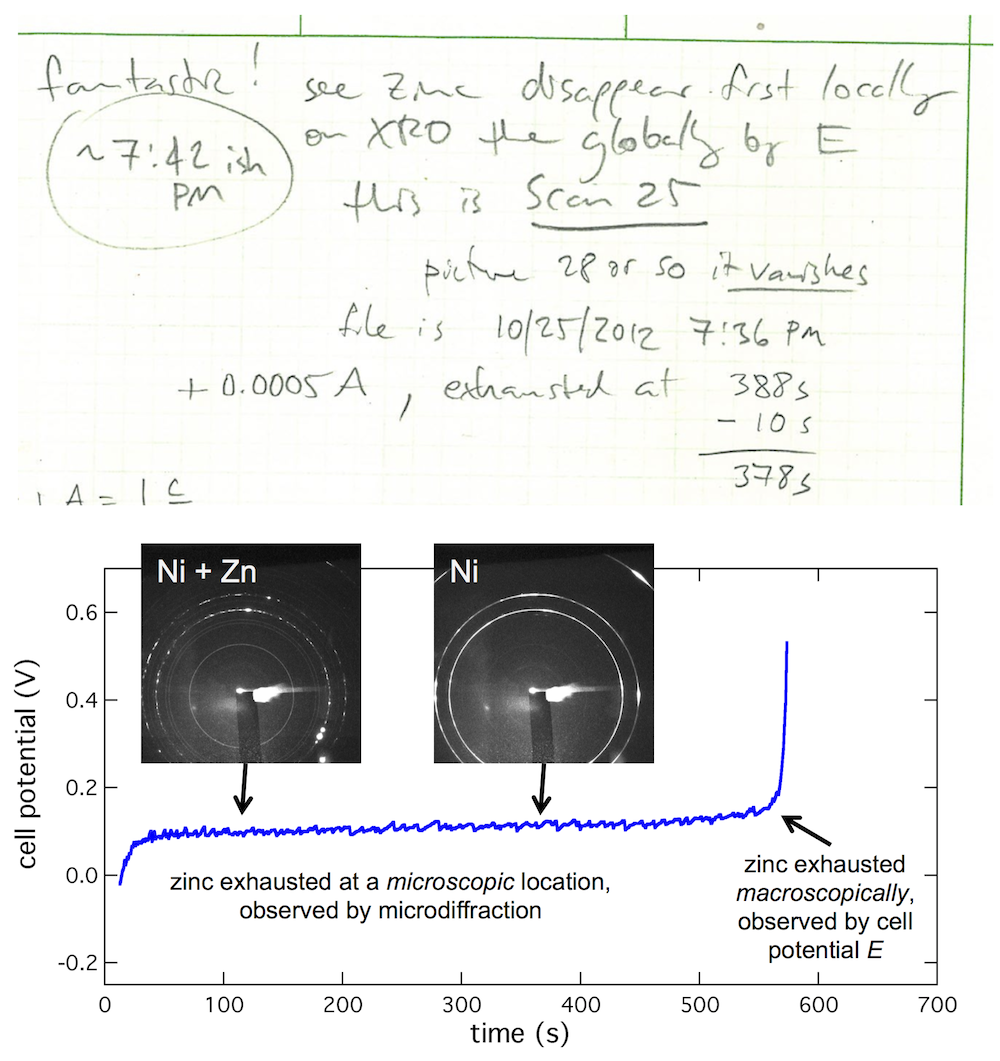
My lab book from the first visit to the beamline shows what kind of thing I was trying to see. I wrote “Fantastic! See zinc disappear first locally on XRD then globally by E.” (And apparently this first worked at about 7:42 PM.) What’s going on is this: zinc is on the anode tab, much as it would be in a battery, then you dissolve the zinc to discharge the battery. When all the zinc is gone, the cell potential (E) will shoot up to high voltage. But that is macroscopic, meaning an average over the entire anode. By focusing the beam on a particular microscopic spot on the anode, you see it dissolve there first, giving you an insight into that small spot in contrast to the entire anode.

xrd micro-macro small

At CUNY we discovered that bismuth can be used to level zinc, but the mechanism wasn’t immediately clear. Using microdiffraction to scan through a zinc layer while it was being plated with bismuth gave a fascinating profile of the two metals, shown below. The XRD signal from the primary reflections of both Bi (012) and Zn (101) were plotted, along with their ratio. The layer was about 52 μm thick. Near the anode tab at 0 μm, the layer was bismuth-poor. Traversing through the layer toward the electrolyte interface, the composition became richer in bismuth, marked by the black arrow. Thus bismuth acts as a metal surfactant on zinc. (Published here.)

microdiffraction Bi-Zn ratio

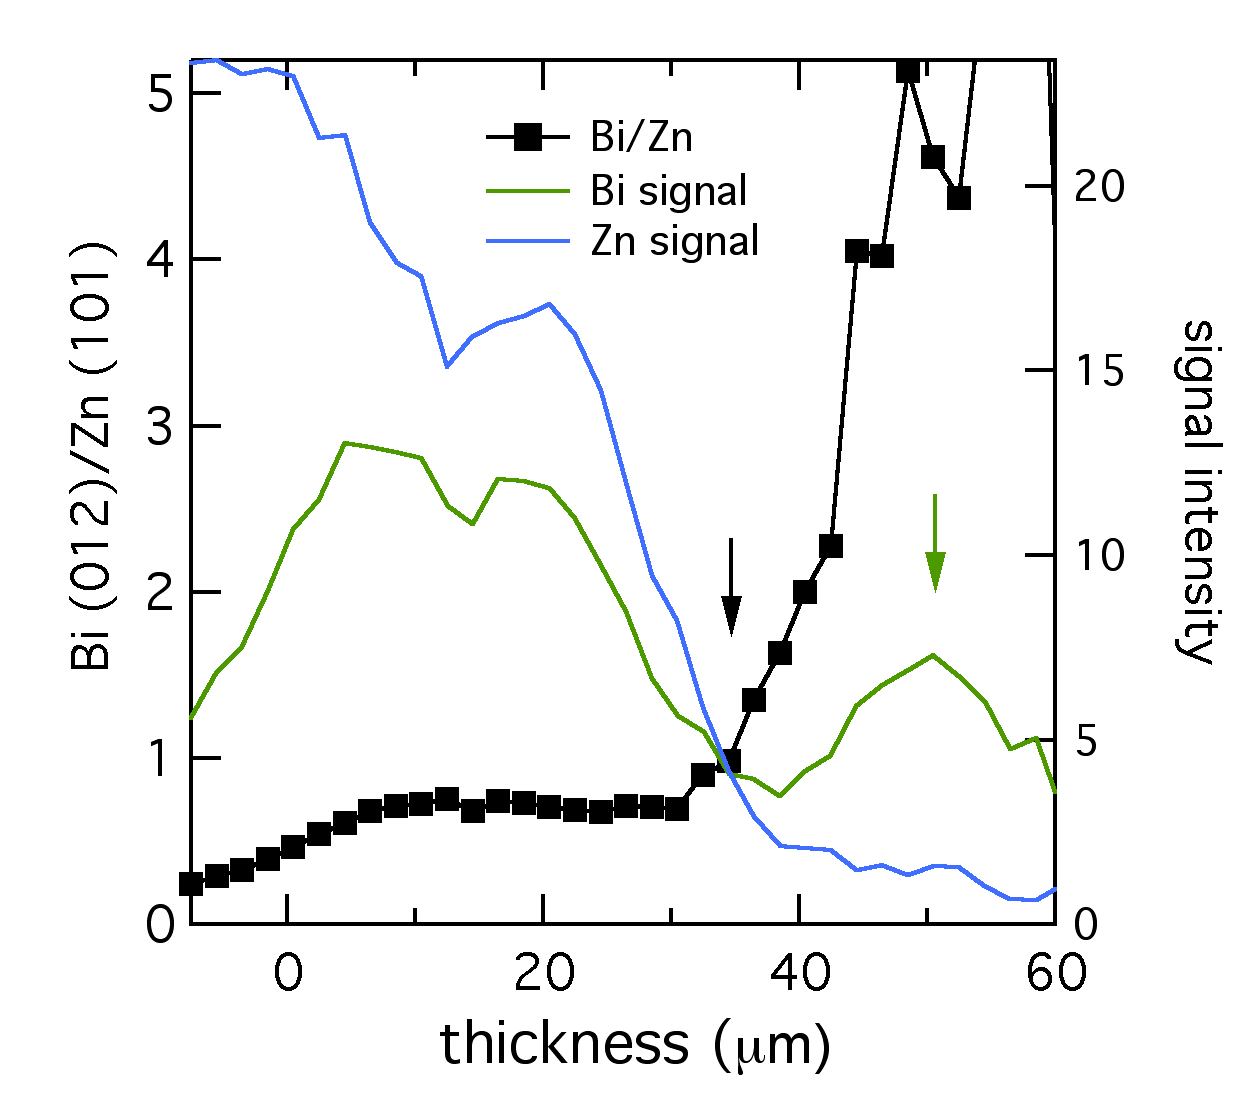
At the very edge of the layer (shown by the green arrow), from 35 to 50 μm, the composition was almost entirely bismuth. The reduced bismuth signal there suggested this section could have the structure of a thin bismuth penumbra decorating the denser layer below. Since this data was collected in situ, this decoration might be a temporary structure present during electroplating, which is altered or destroyed by removing the layer from the electrolyte.

Modeling porous electrodes: Part 2

A secondary current distribution model considers:

  1. Ohm’s law resistance, and
  2. kinetic charge-transfer resistance

while resistance related to concentration variations is ignored. Beginning with the equations given in Modeling porous electrodes: Part 1, the following can be written:

Porous 2 equations

Eq 1 is conservation of charge; Eq 2 is some expression of electrochemical reaction kinetics; and Eqs 3 & 4 are Ohm’s law for the solid and liquid phases. The boundary conditions are such that a current density of I is being produced by the electrode. The liquid phase potential φ2 is arbitrarily set to 0 V at x = 0. The specific expression for the electrode kinetics (Eq 2) needs to be specified. The concentration-independent Butler-Volmer expression can be used:

Porous-2-Butler-Volmer.png

The left hand side of this expression is the transfer current, with units of A/cm3, and gives the amount of electrochemical reaction occurring at any point. The right hand side has two components: the anodic and cathodic kinetic terms. The downside of the Butler-Volmer equation is its complexity. Finding an analytical solution to the above set of differential equations requires a more simplified kinetic expression. One possible simplification is to assume the overpotential (φ– φ2) is highly negative. This means only the cathodic term in the Butler-Volmer equation need be considered:

Porous-2-Tafel

The right hand side of this expression is a form of the Tafel equation. (An analogous anodic form can be used when overpotential is highly positive.) Another possible simplification is to assume the overpotential (φ1 – φ2) is small. In this case both anodic and cathodic terms are important. Substituting the first two terms of a Taylor series for the exponentials results in:

Porous-2-linear

This linear kinetic expression is valid only at low currents. Which approximation of the kinetic expression is appropriate depends on the conditions of interest. Choosing the following values for physical parameters:

  • electrode area per volume, a = 23,300 cm-1
  • transfer coefficients, αaαc = 0.5
  • exchange current density, i0 = 2 x 10⁻⁷ A/cm2
  • current density, I = 0.1 A/cm2
  • length, L = 1 cm
  • electrolyte conductivity, κ = 0.06 S/cm
  • electrode conductivity, σ = 20 S/cm

we assume that the Tafel approximation for kinetics will be valid, because the current density is much larger than the exchange current density. Solving the set of equations 1-4 for both Tafel and linear kinetics gives the results below:

 Porous electrode current

Porous electrode potential

The Tafel kinetic expression predicts that current exchange from liquid to solid phases (ionic current to electronic current) will be concentrated near x = 0, the location closest to the counter electrode. There (φ1 – φ2) will be near 300 mV, falling away further into the electrode. In contrast, the linear kinetic expression predicts a more even exchange of current through the electrode, and much higher values of (φ1 – φ2). This is because the linear expression is a softer function of overpotential than the exponential one. The Tafel approximation is clearly the more appropriate in this case because (φ1 – φ2) » RT/F which is 25.7 mV at room temperature.

2015-03-04 taf-lin trans

Plotting the transfer current di2/dx shows that in reality the electrochemical reaction is concentrated in the front 10% of the electrode. Linear kinetics tend to result in more uniform current distributions, but for this to be the case i0 > I will need to hold.

Click here for Modeling porous electrodes: Part 3, which is about solving porous electrode problems using Newman’s BAND method.

High energy battery characterization

We have a new paper out, which describes work using high energy battery characterization to map the insides of batteries without opening them. “Hetaerolite Profiles in Alkaline Batteries Measured by High Energy EDXRD” is in the current issue of the Journal of the Electrochemical Society. The idea is to use X-rays with high energy and high flux to penetrate a thick battery and collect diffraction data. By setting slits to collimate the X-ray beam, a well-defined gauge volume (GV) is examined within the battery, as illustrated below:

High energy battery characterization

Technically this is called energy dispersive X-ray diffraction or EDXRD. For each sample of data, you obtain three pieces of information: 1) Energy of the photons diffracted, 2) Intensity of the photons diffracted, and 3) Physical location inside the battery. This is plotted as a “diffraction contour” with energy on the x-axis, physical location on the y-axis, and log intensity of the diffraction as pixel darkness. As different crystalline materials diffract X-rays of different energy, you get an XRD fingerprint of the materials. Techniques like this are revolutionizing battery analysis, because physically opening a battery results in unacceptable mixing and oxidation.

Material profiles in discharged batteries

The plot above shows diffraction contours for four AA sized alkaline batteries discharged at different rates. The anodes are mixtures of zinc and zinc oxide, with higher current leaving more zinc behind. The cathodes are mostly mixtures of Mn3O4 and ZnMn2O4, which are nearly identical materials called hausmannite and hetaerolite. Even though these materials have structures differing by only 0.04 angstroms, EDXRD distinguishes them via peak splitting, marked above by blue stars.

The interesting thing is that the highest discharge rate (143 mA) has no hausmannite, but is instead split between hetaerolite and a different material, MnOOH. This shows that these two materials are the first to form, and that hausmannite is only a later product. As discussed in another recent paper, we want to know what reaction pathway leads to hetaerolite, because it limits the rechargeable performance of alkaline batteries. The results above provide the best clue we’re aware of, suggesting there is a groutite -> hetaerolite transition.

Extremely inexpensive grid-scale batteries

We have a new paper out, dealing with our long-term effort to develop extremely inexpensive and safe batteries for large-scale use. The full title is “Rechargeability and economic aspects of alkaline zinc-manganese dioxide cells for electrical storage and load leveling.” The idea driving the research is that since DOE cost targets for grid-scale storage are very low ($100/kWh), battery design should begin with the cheapest and safest materials possible, instead of trying to adapt high-power lithium-ion battery designs.

Zinc and manganese dioxide fit that bill, and what the paper shows is that by reducing the depth of discharge (DOD) to some fraction of the full capacity, long cycle life can be achieved at extremely low cost. The plot below shows that at 10% DOD over 3000 cycles are typical, while at 20% DOD it is over 500. These are base designs, focusing on electrode construction, materials, porosity, etc, with no additives or specialty materials. Assuming one cycle a day, this is an 8.5 year lifespan at 10% DOD.

Zn-MnO2 cycle life

Cycling a fraction of the DOD like this allows a long lifespan, while keeping the cost low. This shallow-cycled Zn-MnO2 battery comes in very low in lifetime investment cost, 2-5 ¢/kWh/cycle. Using numbers taken from the literature, this is in or below the projected range of vanadium-redox and sodium-metal-halide (ZEBRA) batteries, while being low-temperature and generally lower complexity than these. An extra benefit is that since only a fraction of the Zn-MnO2 capacity is cycled, the reserve capacity can be used in emergencies.

Zn-MnO2 lifetime cost

Over the last few years we’ve developed these types of batteries in many shapes and sizes, supported by DOE’s ARPA-E program as well as other entities like the utility Con Edison. A couple of battery racks in the CUNY lab are shown below. A little over a year ago Urban Electric Power LLC was spun out, and in their battery labs a few blocks away on 127th Street they’ve been developing the batteries for commercialization, and refining the design for higher power and longer life.

CUNY Energy Institute battery racks

Our analysis in the paper addresses evolution of the batteries during their lifetime. If you notice above, at 10% DOD the efficiency falls from near 90% to near 80% during cycling, due to a kind of “formation” of the materials. The analysis, which was Nilesh Ingale’s doctoral thesis, is too dense to describe in full but a combined modeling+experimental effort shows that the MnO2 active particles in the cathode become coated with hetaerolite (ZnMn2O4) and this resistive film drops performance. Below you see this resistivity plotted against cycle number, showing the effect mostly occurs in the first 150 cycles. Preventing this will help efficiency, but could also impact how the batteries are made and lower cost.

Zn-MnO2 film formation